Start with the question you are trying to answer
‘How much stock should I take to a craft fair?’ contains several decisions. You may be choosing whether to book a table, working out what to make, or deciding how many boxes fit in the car. Each needs different inputs. Multiplying a stall fee by a fixed number skips your prices, costs, existing stock and making time.
Start with a lower, middle and higher sales estimate if you have evidence from similar events. Use an income goal if you want to check how many sales a desired result would require. If this is your first fair, label both as assumptions and keep the plan affordable if sales are lower.
| Check | Question | Useful input |
|---|---|---|
| Demand | What might customers buy? | Comparable event sales, stock-outs and enquiries |
| Money | What sales would cover the entered costs and goal? | Selling price, per-item costs and event costs |
| Capacity | Can I make and carry that much? | Available stock, minutes per item, hours and packing space |
Calculate required sales before adding display stock
For a simple single-product or average-product model, contribution per sale is selling price minus the costs entered for each sold item. Divide fixed event costs by that contribution for break-even units. Add the desired amount left over to fixed costs before dividing to find the units needed for your goal. Round up to a whole item.
Here is a fictional plan: £60 stall fee, £20 other event costs, £18 average selling price and £6 cost per sold item. Each sale leaves £12 towards the fixed costs and goal. A goal of £160 left after those entered costs requires 20 sales: (£80 + £160) ÷ £12. It is a requirement, not a prediction.
| Calculation | Result |
|---|---|
| Contribution per sold item: £18 − £6 | £12 |
| Fixed event costs: £60 + £20 | £80 |
| Break-even: £80 ÷ £12, rounded up | 7 sales |
| Sales required for £160 goal: (£80 + £160) ÷ £12 | 20 sales |
| At 20 sales: £360 revenue − £120 item costs − £80 event costs | £160 left after entered costs |
The £6 is an illustrative input, not a recommended cost allowance. Include the labour, packaging and selling fees you want this model to cover. Omitted costs, tax and cash spent on unsold stock are not deducted automatically.
U.S. Small Business Administration: the break-even formula ↗
A mixed range needs a realistic sales mix
An average price only helps if it resembles the items likely to sell. A table full of £30 pieces does not justify a £30 average when most purchases are £8 gifts. Build the average from a stated mix and change it when that mix changes.
For example, a plan of ten £12 items and ten £24 items has an £18 average selling price. If their per-item costs are £4 and £8 respectively, the average cost is £6. That supports the simple model above. A different mix changes both averages; do not average product prices without considering quantities.
Check individual prices before scaling production. The crochet pricing calculator lets you examine materials, time, packaging, overhead assumptions and selling fees for one item. It does not establish that customers will buy at the result. Use that calculation alongside what you learn at actual events.
Check an item's costs with the free crochet pricing calculator →
Turn 20 required sales into a making plan
Suppose you choose a 20% stock buffer for the example. Twenty planned sales becomes 24 items to bring. The buffer is stock available for choice and display; it does not increase expected sales to 24. Choose it for your display and ability to reuse unsold items, rather than treating 20% as an industry rule.
Allocate half the stock to small pieces and half to larger pieces. Subtract only ready stock that is saleable and available for this event. Items reserved for custom orders are not available just because they are in the same cupboard.
| Product group | Bring | Ready | Make | Minutes each | Making time |
|---|---|---|---|---|---|
| Small pieces | 12 | 6 | 6 | 20 | 2 hours |
| Larger pieces | 12 | 4 | 8 | 45 | 6 hours |
| Total | 24 | 10 | 14 | — | 8 hours |
If only six making hours are available, this plan is two hours over capacity before packing, labels and travel preparation. Change the plan explicitly instead of assuming the extra time will appear.
Try sales scenarios and income goals in the free stock calculator →
Stress-test the lower-sales day
Keep the same £18 average price, £6 per-sale cost and £80 fixed costs, but test ten sales. The result is £180 revenue minus £60 entered item costs minus £80 event costs: £40 left after those costs. With six sales, the model is £8 below break-even. Neither figure includes costs you left out.
Now examine cash separately. Buying materials for all 14 new items may require money before the fair, even if only a few sell. Reusable unsold stock can go to another event, but the cash used to make it is still unavailable today. Seasonal or personalised pieces may be harder to reuse.
A reasonable next move could be using existing stock, reducing the range or choosing a cheaper event. If you change the mix or price, rerun the money calculation. Reducing making time by dropping higher-priced pieces can also reduce the average sale, so one improvement may change another part of the plan.
Use the event record to improve the next plan
After the fair, compare planned units with sold units by product, note when anything sold out and reconcile stock physically. Record enquiries separately from purchases. A popular display piece and a frequently purchased product are not necessarily the same thing.
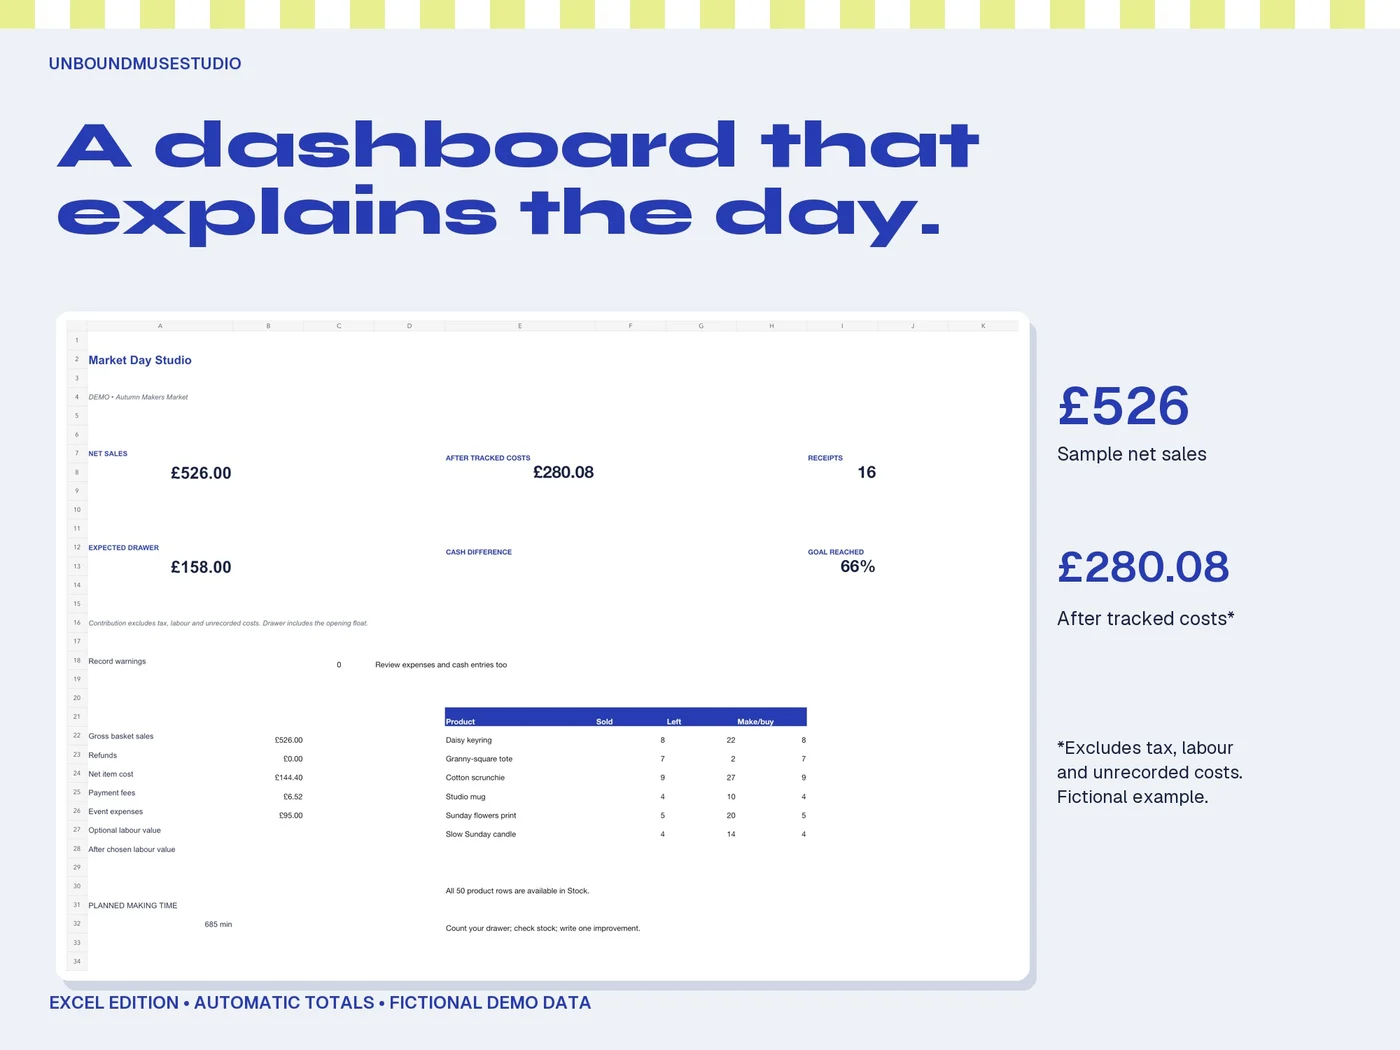
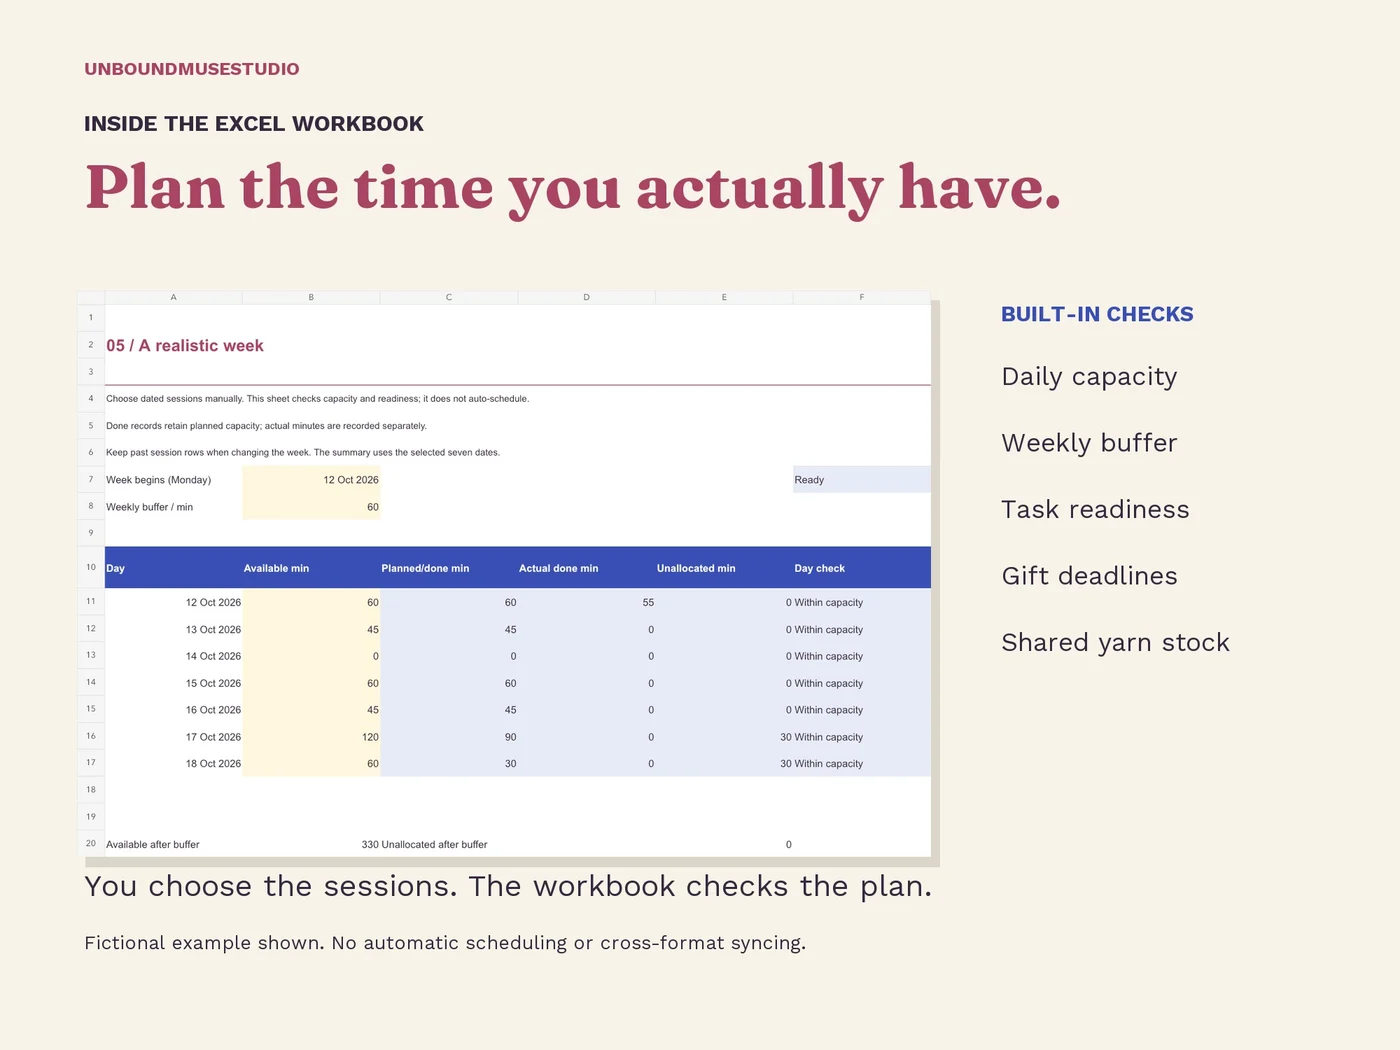
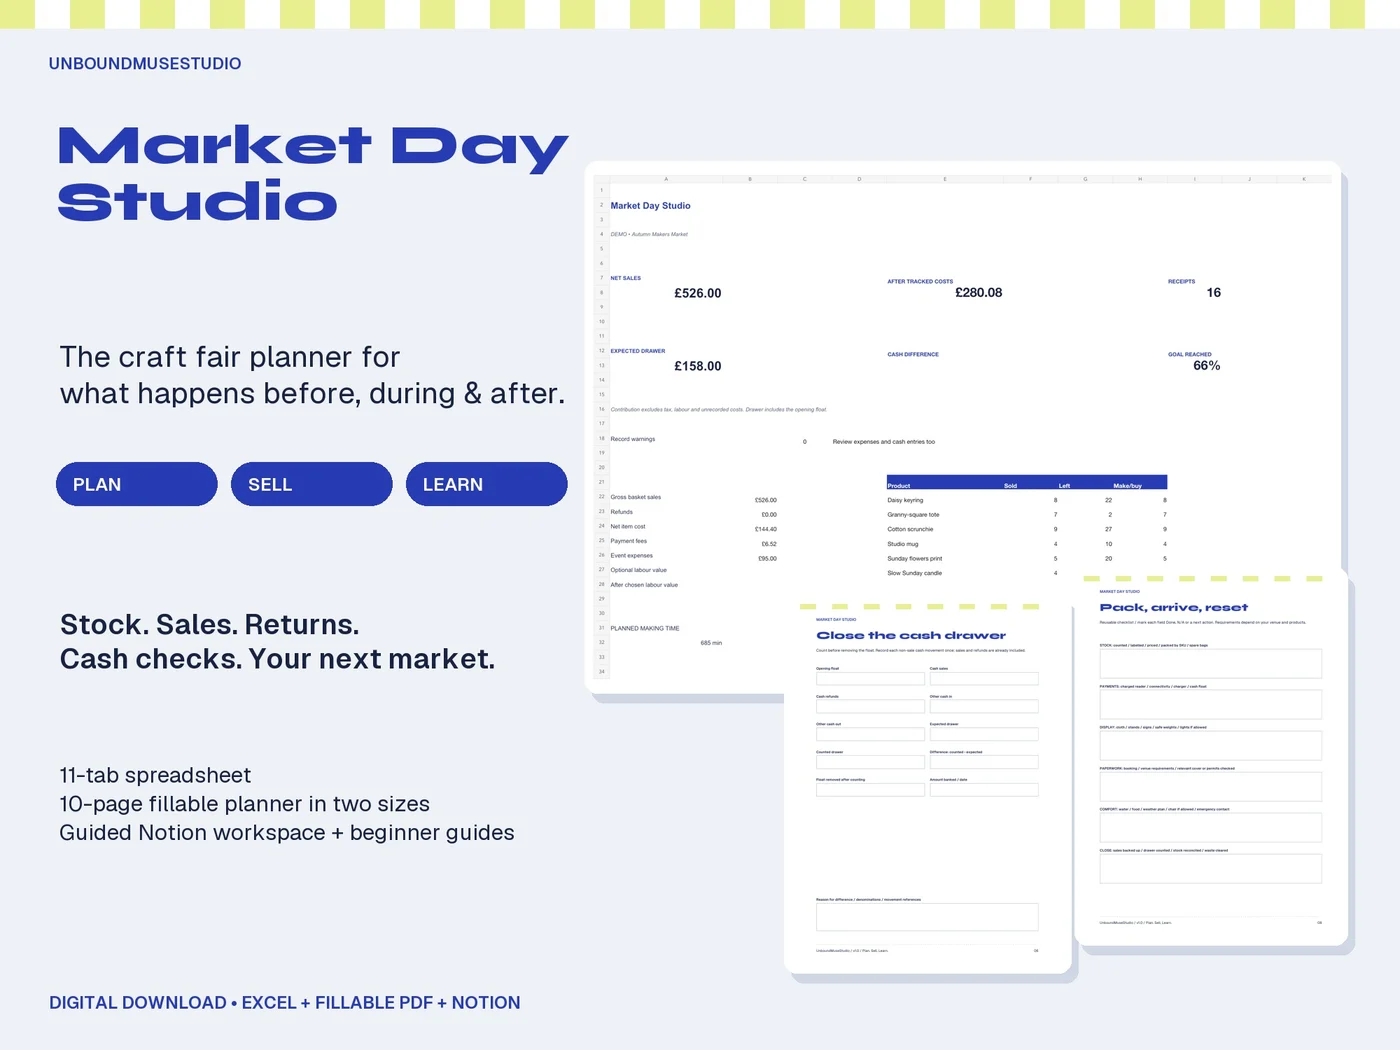
Use the free inventory sheet if you need a simple opening and closing count. Market Day Studio adds a prepared structure for event planning, stock, sales and review across spreadsheet, fillable PDF and Notion formats. The formats work independently; PDF totals and most Notion calculations are manual. Choose the tool that matches the record you will actually maintain.
Use the free craft fair inventory sheet →